Jakarta Job Market Analysis
Comprehensive Analysis of 19,686 Job Postings on JobStreet Indonesia
Methodology
- Data Scraping: Data was collected using a custom Playwright-based scraper to navigate dynamic content on JobStreet Indonesia. The system automated pagination and detailed extraction to capture 19,686 unique job postings across Jakarta, ensuring high fidelity by handling lazy loading and anti-bot measures.
- Analysis Pipeline: The raw data underwent a rigorous cleaning process using Python (Pandas) to remove 322 duplicates and standardize inconsistent fields. Advanced analysis included NLP-based text mining for skill extraction and custom scoring algorithms to evaluate 'Accessibility' (entry barriers) and 'Transparency' (salary disclosure rates).
- Cleaned Dataset is available here.
Dataset Overview
Work Type Distribution
| Type | Count | % |
|---|---|---|
| Full-time | 16,117 | 81.9% |
| Contract/Temp | 3,081 | 15.6% |
| Part-time | 350 | 1.8% |
| Casual | 113 | 0.6% |
Work Arrangement
| Arrangement | Count | % |
|---|---|---|
| On-site | 18,711 | 95.1% |
| Hybrid | 659 | 3.4% |
| Remote | 316 | 1.6% |
Top 10 Job Categories
| # | Category | Jobs | % Share | Distribution |
|---|---|---|---|---|
| 1 | Financial Accounting & Reporting | 1,320 | 6.7% | |
| 2 | Sales Representatives/Consultants | 1,017 | 5.2% | |
| 3 | Administrative Assistants | 811 | 4.1% | |
| 4 | Management | 663 | 3.4% | |
| 5 | Retail Assistants | 660 | 3.4% | |
| 6 | Marketing Communications | 636 | 3.2% | |
| 7 | Account & Relationship Mgmt | 603 | 3.1% | |
| 8 | Developers/Programmers | 577 | 2.9% | |
| 9 | Consulting & Generalist HR | 557 | 2.8% | |
| 10 | New Business Development | 527 | 2.7% |
Geographic Distribution
| Region | Jobs | % | Median Salary |
|---|---|---|---|
| Jakarta (General) | 6,119 | 31.1% | IDR 7,250,000 |
| Other Areas | 5,869 | 29.8% | IDR 4,750,000 |
| South Jakarta | 2,509 | 12.8% | IDR 7,500,000 |
| North Jakarta | 1,767 | 9.0% | IDR 6,750,000 |
| West Jakarta | 1,652 | 8.4% | IDR 6,250,000 |
| Central Jakarta | 1,352 | 6.9% | IDR 6,600,000 |
| East Jakarta | 418 | 2.1% | IDR 6,188,000 |
Salary Analysis
Salary Distribution
| Band | Jobs | % |
|---|---|---|
| < 4M IDR | 901 | 13.8% |
| 4M - 6M IDR | 2,193 | 33.7% |
| 6M - 8M IDR | 1,505 | 23.1% |
| 8M - 10M IDR | 681 | 10.5% |
| 10M - 15M IDR | 696 | 10.7% |
| > 15M IDR | 538 | 8.3% |
Top Paying Categories
| Category | Median |
|---|---|
| Management | 11.5M |
| Developers/Programmers | 8.9M |
| New Business Dev | 7.5M |
| Account & Relationship | 7.5M |
| HR Consulting | 7.0M |
| Financial Accounting | 6.5M |
Salary Distribution
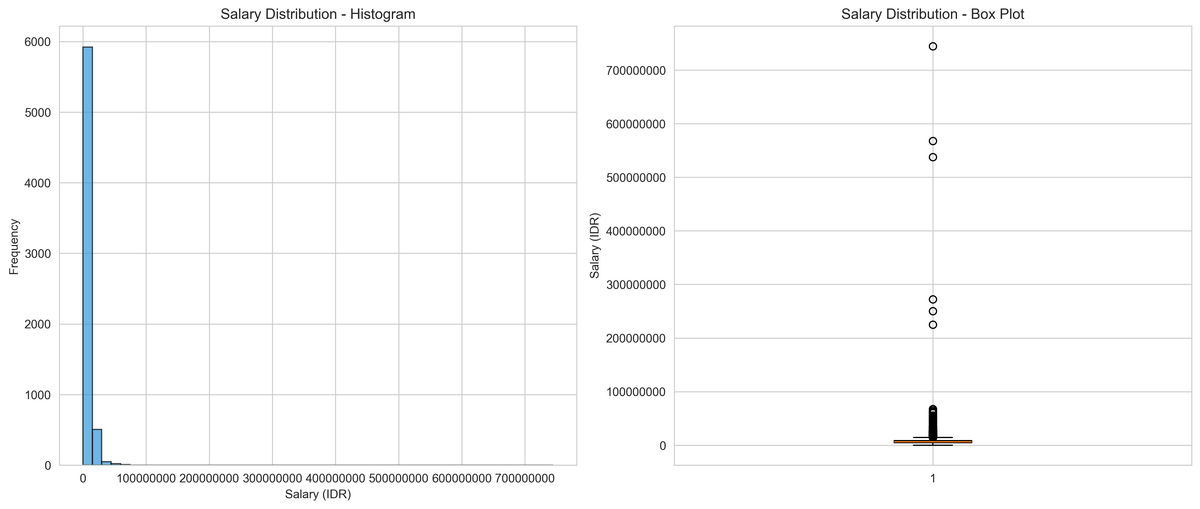
The 4M-6M IDR range dominates the market (33.7% of offers), while high-income roles (>15M) remain scarce at just 8.3%.
Salary by Category
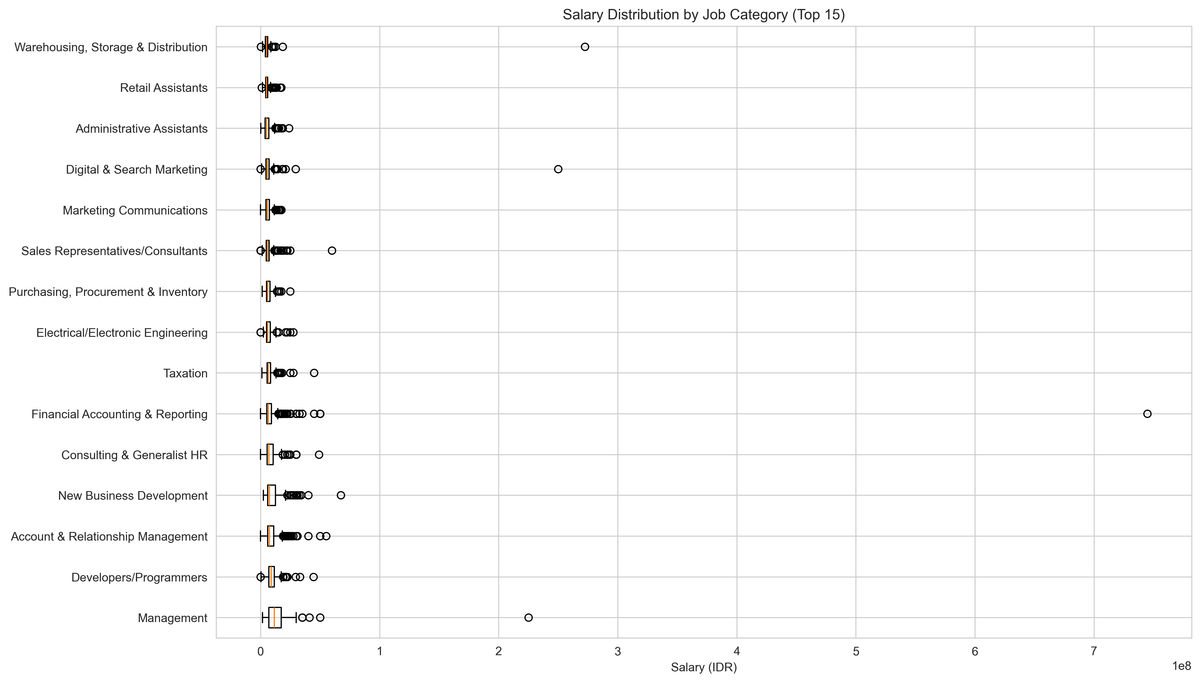
Management roles command the highest median pay (11.5M IDR), significantly outpacing administrative and operational functions.
Skills & Requirements
Top 15 Most Demanded Skills
| # | Skill | Jobs | % |
|---|---|---|---|
| 1 | ERP Systems | 7,683 | 39.0% |
| 2 | Excel | 6,568 | 33.4% |
| 3 | Communication | 5,832 | 29.6% |
| 4 | Data Analysis | 5,397 | 27.4% |
| 5 | Sales | 4,871 | 24.7% |
| 6 | Marketing | 3,567 | 18.1% |
| 7 | English | 3,509 | 17.8% |
| 8 | Design | 2,374 | 12.1% |
| 9 | Finance | 2,329 | 11.8% |
| 10 | Analytical | 2,250 | 11.4% |
| 11 | MS Office | 2,044 | 10.4% |
| 12 | Accounting | 2,012 | 10.2% |
| 13 | Interpersonal | 1,875 | 9.5% |
| 14 | Leadership | 1,865 | 9.5% |
| 15 | SAP | 1,008 | 5.1% |
Education Requirements
| Level | Jobs | % |
|---|---|---|
| S1/Bachelor | 9,641 | 49.0% |
| D3/Diploma | 3,244 | 16.5% |
| SMA/SMK | 1,674 | 8.5% |
| S2/Master | 500 | 2.5% |
| S3/PhD | 93 | 0.5% |
Experience Requirements
| Level | Jobs | % |
|---|---|---|
| Fresh Graduate | 1,671 | 8.5% |
| 0-1 years | 2,416 | 12.3% |
| 1-3 years | 5,385 | 27.4% |
| 3-5 years | 2,194 | 11.1% |
| 5+ years | 1,448 | 7.4% |
Top Skills
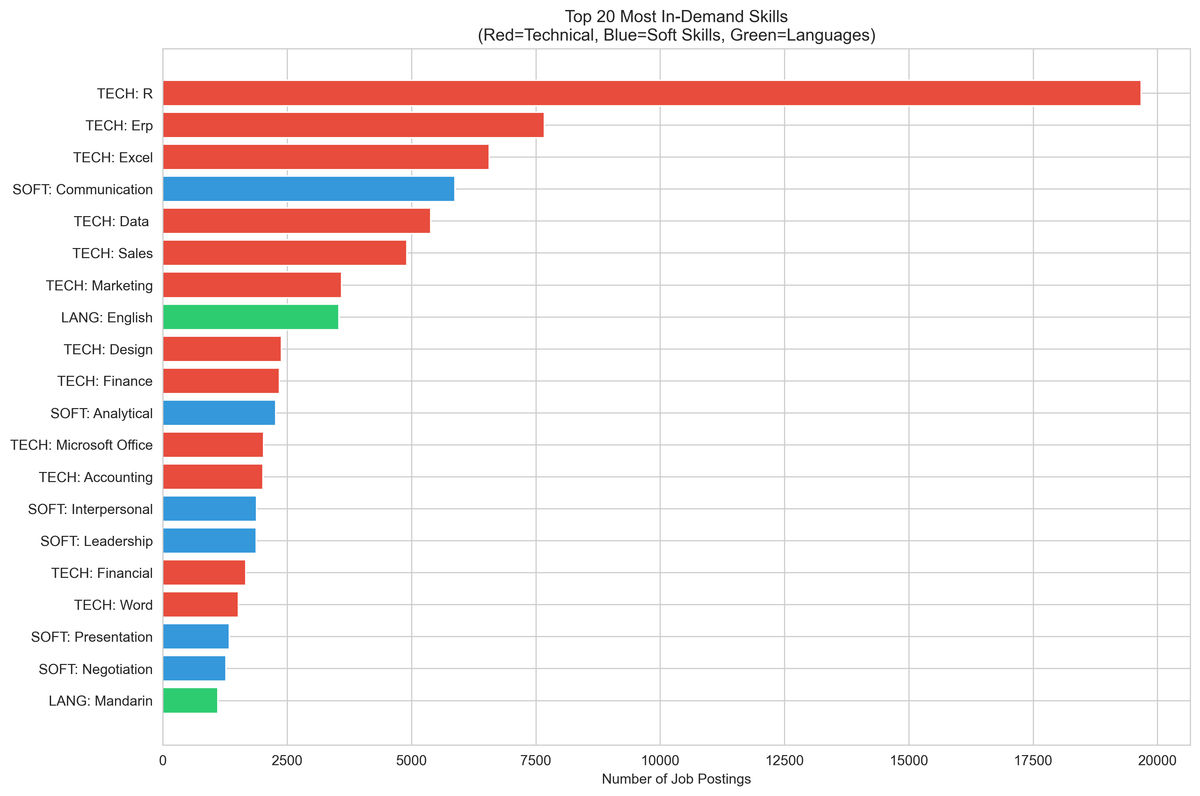
Technical proficiency in ERP Systems (39%) and Excel (33%) outranks soft skills, indicating a strong focus on operational readiness.
Education Requirements
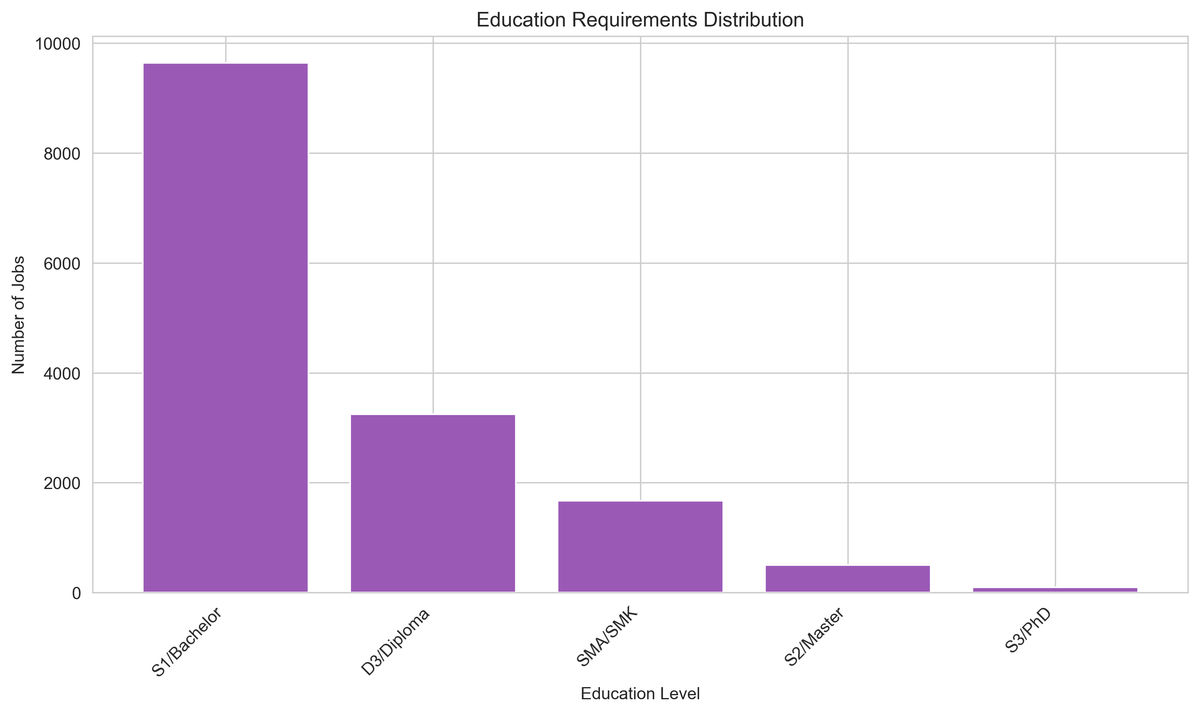
A Bachelor's degree (S1) is the new standard, required for 49% of listings, creating a high barrier for SMA/SMK graduates (8.5%).
Job Accessibility Analysis
Accessibility Distribution
| Level | Jobs | % |
|---|---|---|
| Easy (80+) | 719 | 3.7% |
| Accessible (60-80) | 14,389 | 73.1% |
| Moderate (40-60) | 4,578 | 23.3% |
| Hard (<40)< /span> | 0 | 0.0% |
Skill Overload Analysis
| Level | Jobs | % |
|---|---|---|
| Low (1-2 skills) | 5,153 | 26.2% |
| Moderate (3-4) | 7,570 | 38.5% |
| High (5-6) | 4,575 | 23.2% |
| Very High (7-9) | 2,106 | 10.7% |
| Extreme (10+) | 282 | 1.4% |
Accessibility Distribution
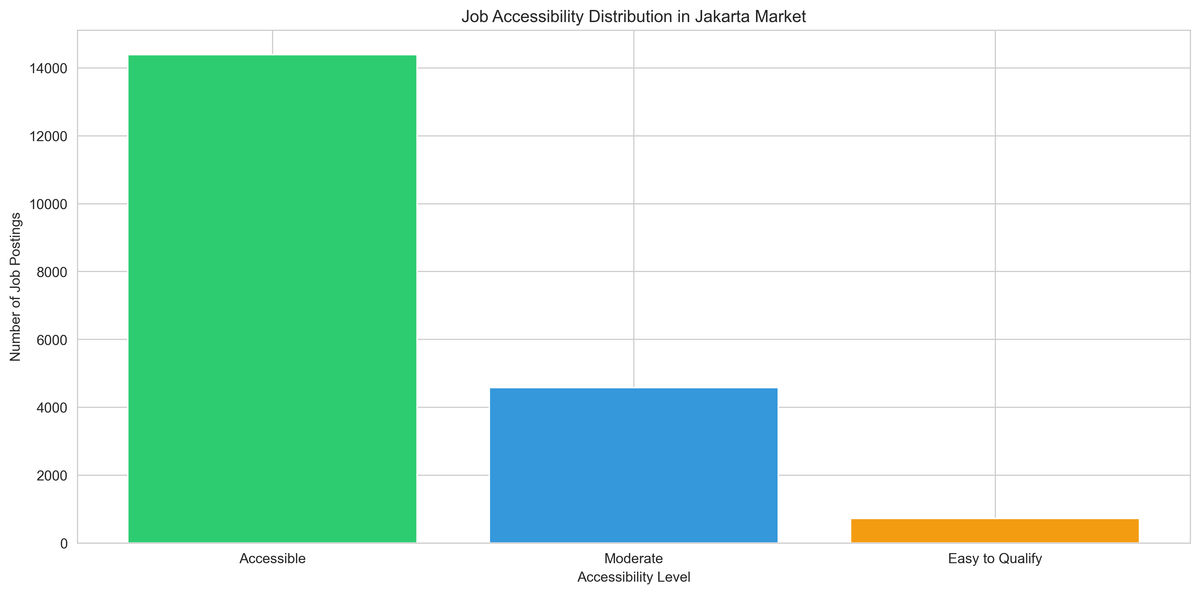
73% of jobs fall in the 'Accessible' range (60-80 score), suggesting moderate entry barriers, though 'Easy' entry roles are rare (3.7%).
Skills vs Salary
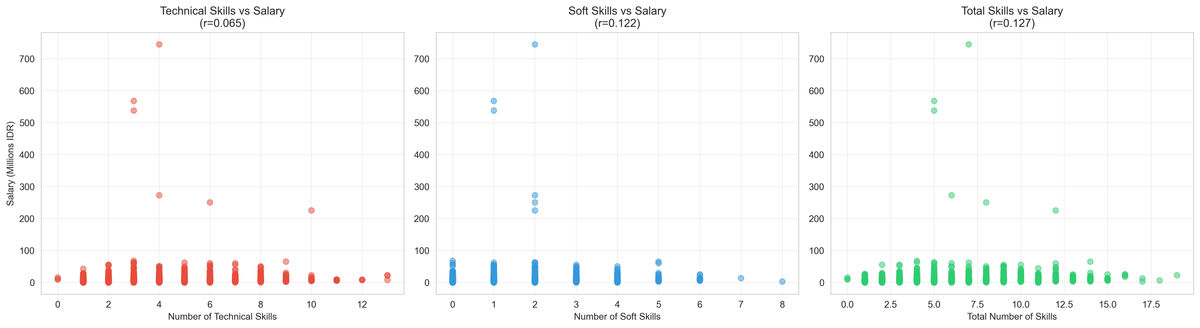
A weak correlation (0.13) confirms that demanding a higher volume of skills does not significantly translate to higher pay offers.
Fresh Graduate & Entry-Level Analysis
Entry-Level Summary
| Metric | Value |
|---|---|
| Total Entry-Level Jobs | 3,714 (18.9%) |
| Fresh Grad Friendly | 1,759 (8.9%) |
| Experience Paradox Cases | 453 (12.2%) |
| Mean Experience Required | 4.73 years |
Best Categories for Fresh Grads
| Category | Jobs | % |
|---|---|---|
| Financial Accounting | 134 | 7.6% |
| Administrative Assistants | 119 | 6.8% |
| Sales Representatives | 87 | 4.9% |
| Marketing Communications | 67 | 3.8% |
| Account & Relationship Mgmt | 48 | 2.7% |
| Developers/Programmers | 45 | 2.6% |
Experience Distribution
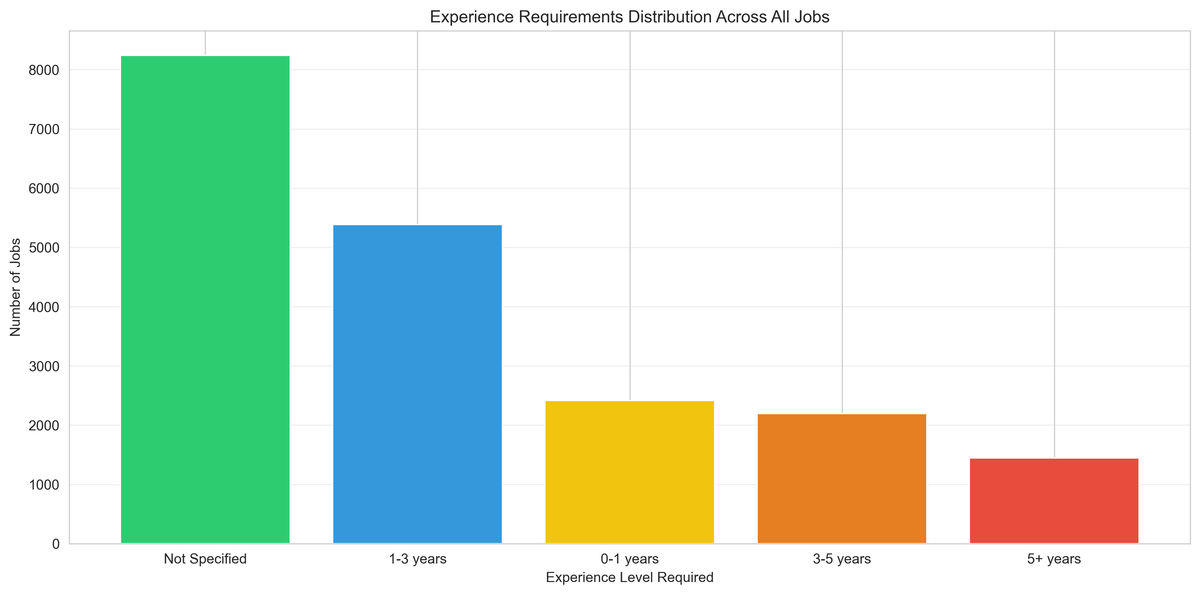
The '1-3 years' experience bracket accounts for 27% of demand, creating a bottleneck for true fresh graduates (only 8.5%).
Experience by Category
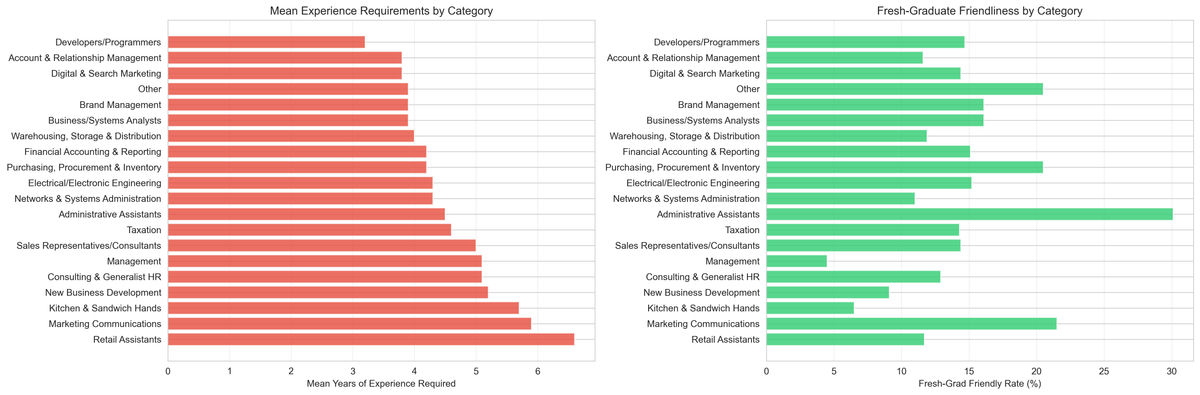
Technical roles (Devs/Engineering) demand higher baseline experience compared to Sales and Admin support roles.
Transparency Analysis
Transparency Metrics
| Metric | Value |
|---|---|
| Salary Disclosed | 6,514 (33.1%) |
| Salary Hidden | 13,172 (66.9%) |
| Benefits Listed | 2,185 (11.1%) |
| Very Transparent Jobs | 5,472 (27.8%) |
Transparency by Work Type
| Arrangement | Disclosure Rate |
|---|---|
| Remote | 50% |
| Hybrid | 40% |
| On-site | 30% |
Transparency Analysis
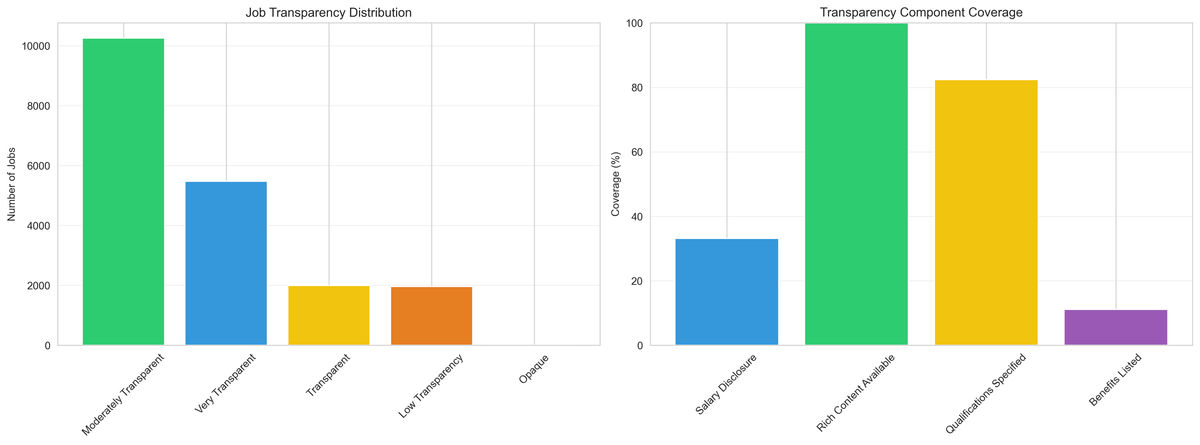
Salary transparency remains vertically low at 33.1%, forcing the majority of candidates (66.9%) to negotiate blindly.
Salary Disclosure Patterns
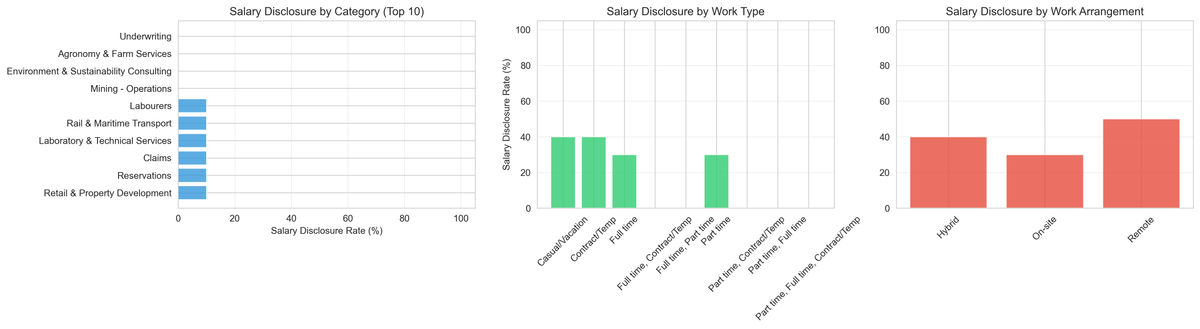
Remote positions are significantly more transparent (50% disclosure) than traditional on-site roles (30%).
Key Insights & Recommendations
For Job Seekers
- Must-Have Skills: Excel (33%), Communication (30%), ERP Systems (39%), English (18%)
- Target Locations: South Jakarta offers highest median salary (IDR 7.5M). Avoid non-Jakarta areas for 30%+ salary premium.
- Education Matters: Bachelor's degree opens 49% of the market. Consider D3 for quick entry (16.5% of jobs).
For Employers
- Transparency Gap: Only 33.1% disclose salary. Publishing ranges can improve application quality and reduce time-to-hire.
- Over-specification Risk: Weak skills-salary correlation (0.127) suggests job requirements may be inflated. Focus on essential skills.
For Policy Makers
- Remote Work Gap: Only 1.6% remote positions limits geographic inclusion. Consider incentives for flexible work.
- Fresh Grad Barriers: Only 8.9% of jobs explicitly welcome fresh graduates. Youth employment programs needed.
All Visualizations
Top Job Categories
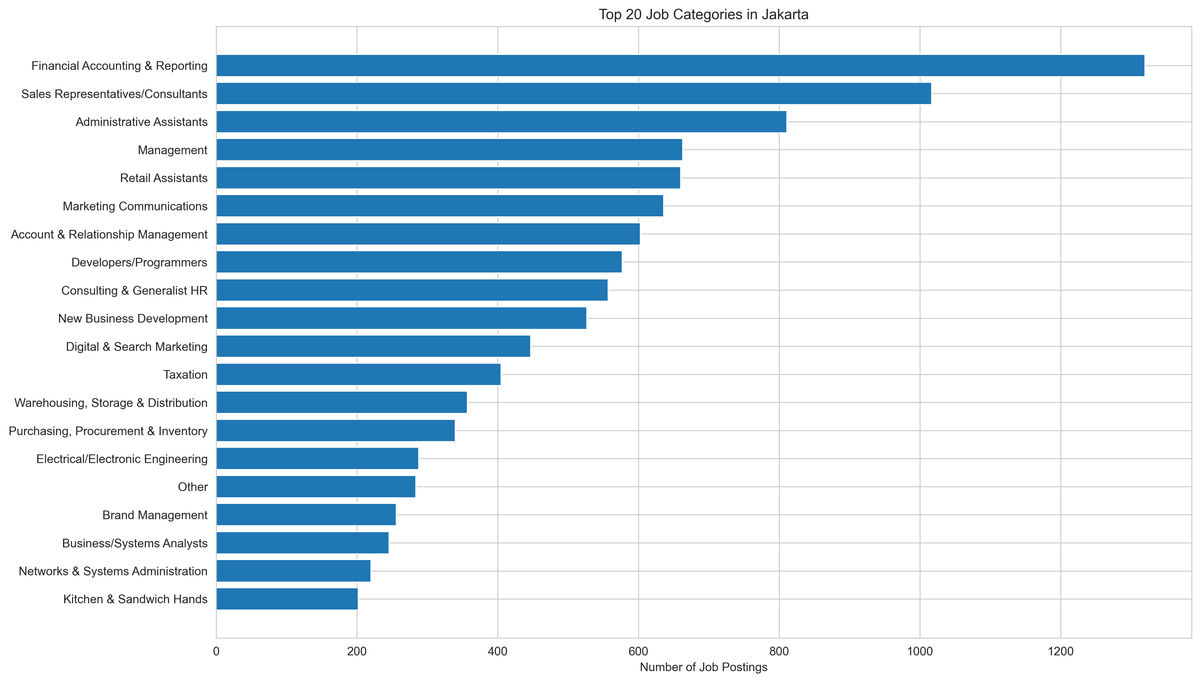
Finance and Sales dominate the market, collectively accounting for nearly 12% of all available positions.
Work Type

The market is rigid, with Full-time contracts (82%) vastly outnumbering freelance or part-time flexibility.
Work Arrangement
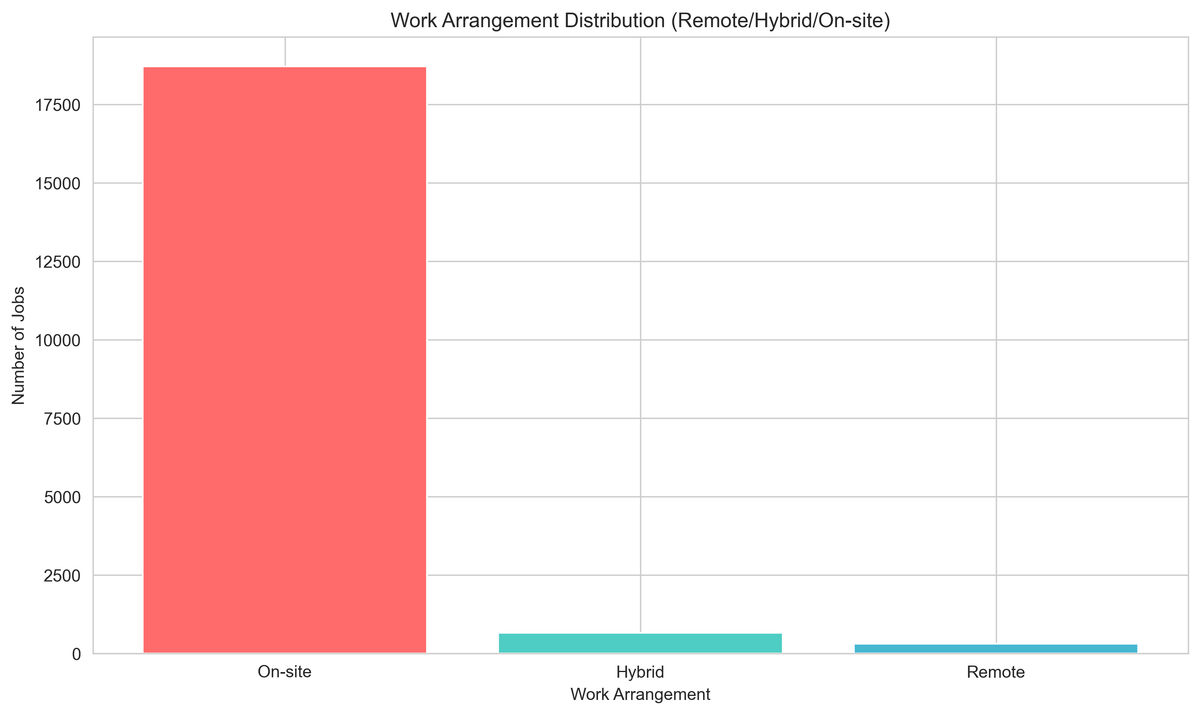
Remote work has stagnated at 1.6%, showing a strong return-to-office mandate (95% On-site).
Jakarta Regions
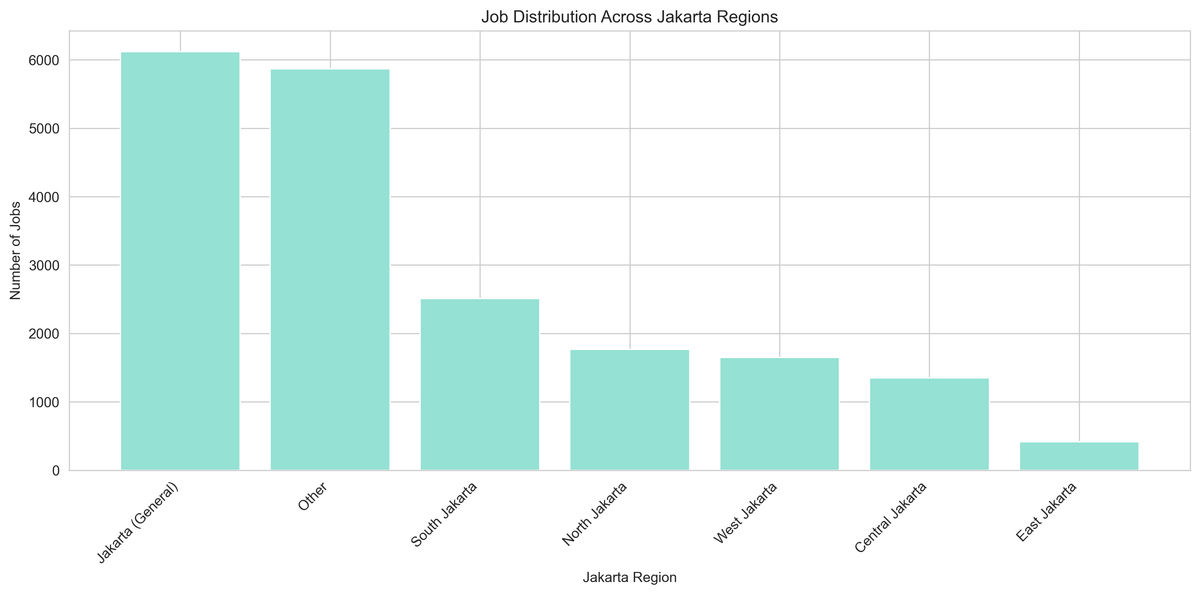
South Jakarta remains the primary business hub (12.8%), while huge portions of listings are generic 'Jakarta'.
Top Employers
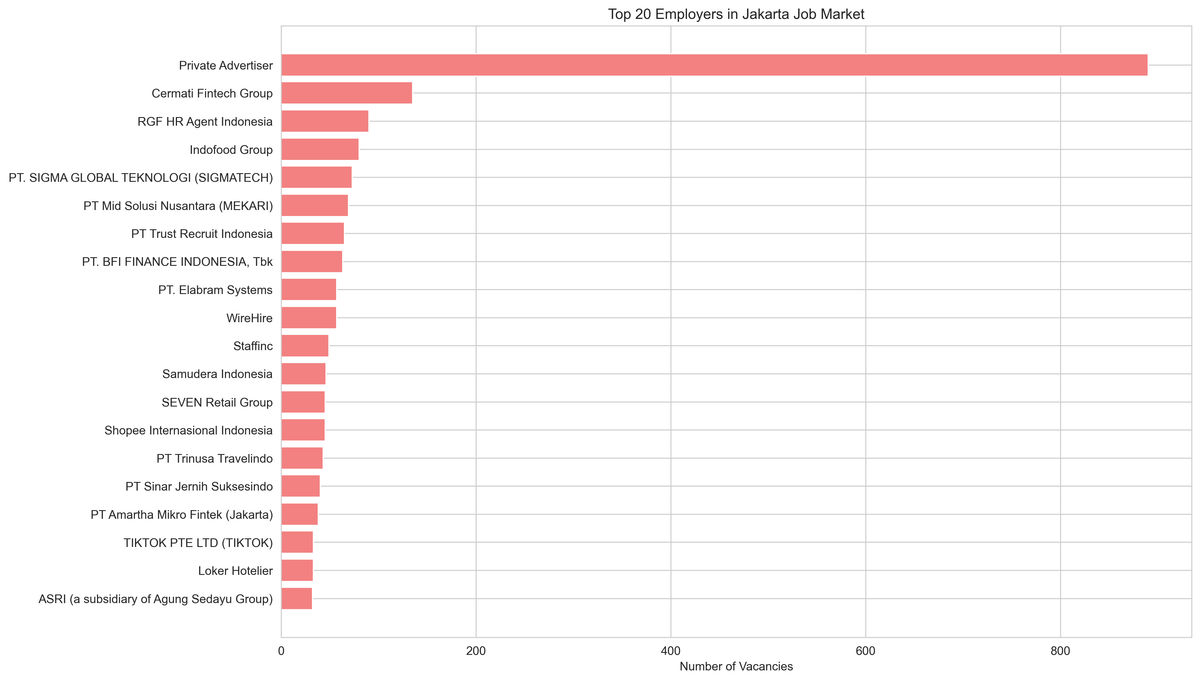
Major hiring activity is consolidated among a few key players in banking, tech, and retail sectors.
Salary by Region
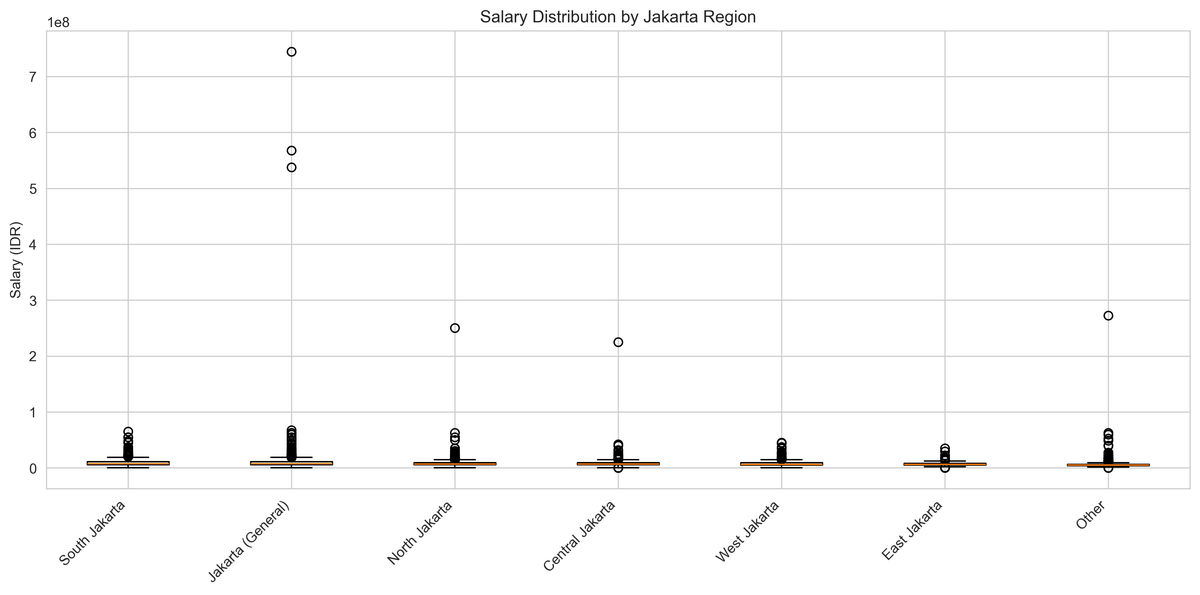
South Jakarta commands a premium (7.5M Median), roughly 20% higher than West or East Jakarta salaries.
Accessibility vs Salary
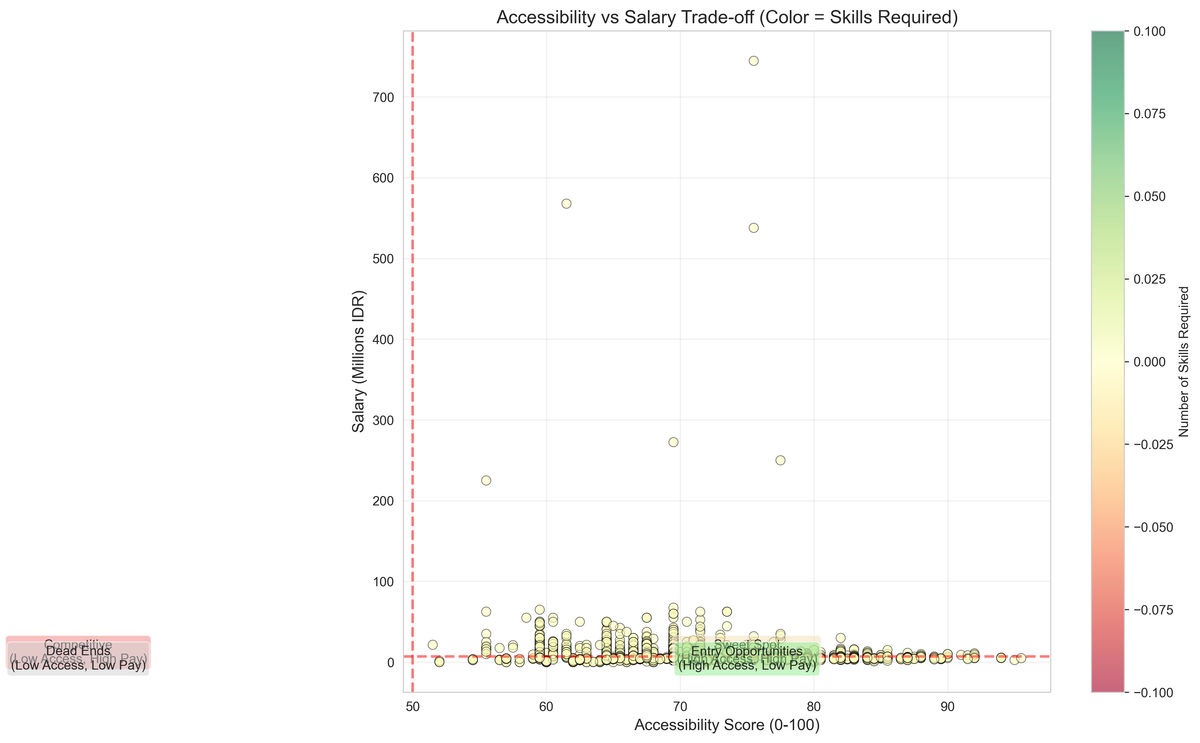
Higher paying roles correlate with lower accessibility scores, reflecting stricter experience and skill requirements.
Transparency vs Accessibility
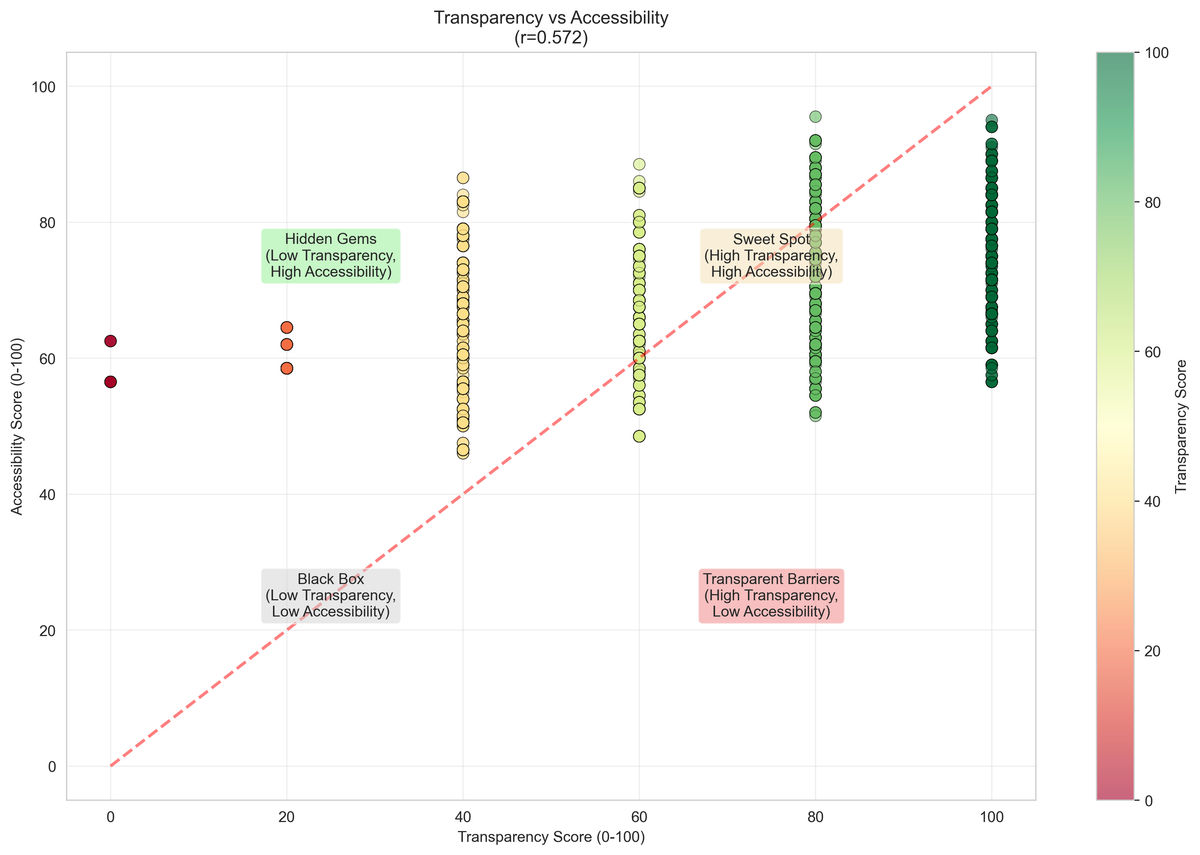
Jobs that disclose salaries tend to have clearer requirements, resulting in slightly higher accessibility scores.